Ayla Insights
Ayla Insights is a fully-integrated business intelligence platform that provides Ayla customers with real-world insights into how their connected products are being used. This is a direct path for customers to unlock the value of their data by offering a way to visualize, analyze, and explore their data quickly, regardless of the device type.
The Insights data platform completes the feedback loop for manufacturers, enabling them to quickly and easily uncover the actionable data needed to improve product development, customer satisfaction, and revenues.
There are ten sets of reports in Ayla Insights that provide data pertaining to the components of your connected devices. Each report has filters so that you can tailor the results for your specific analysis needs. Click the linked report below for a complete description of it:
|
NOTE |
The remaining reports (below) are under Advance Reports in the Ayla Insights navigation panel. Contact your Ayla Product Specialist if you don't see these reports or cannot access any of them. |
- Onboarding Analysis Reports
- Device Trends Reports
- Device Software Analysis Reports
- Device Transmission Analysis Reports
- Device Details Reports
- User Analysis Reports
- Notification Analysis Reports
- Datapoint Transmission Trends Reports
- Datapoint Analysis Reports
Ayla Insights is easy to access, navigate, and use on the Ayla Customer Dashboard, as explained below:
- Log in to the Ayla Customer Dashboard using your current log-in credentials.
|
NOTE |
These are the credentials you set up to register for a developer’s account. If you have not done this, refer to the Ayla Developer’s Portal User’s Guide, AY006UDP3 on Ayla Connection. |
- Type your credentials in the Sign In dialog box (shown below) to open Ayla Insights. These are the same credentials described in Step 1 above.
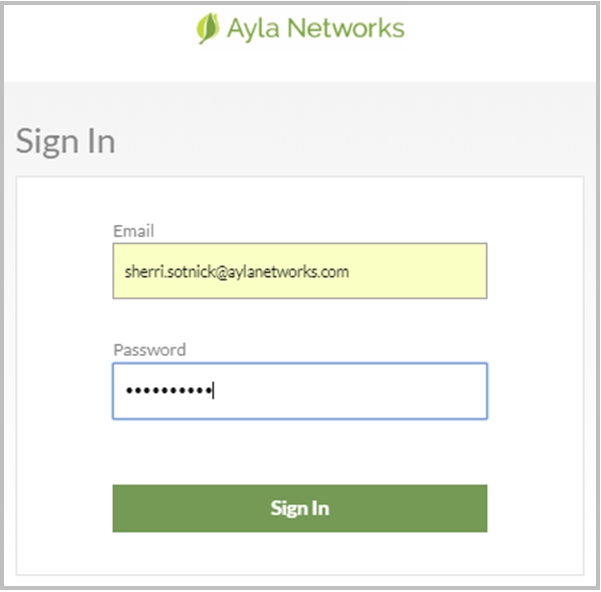
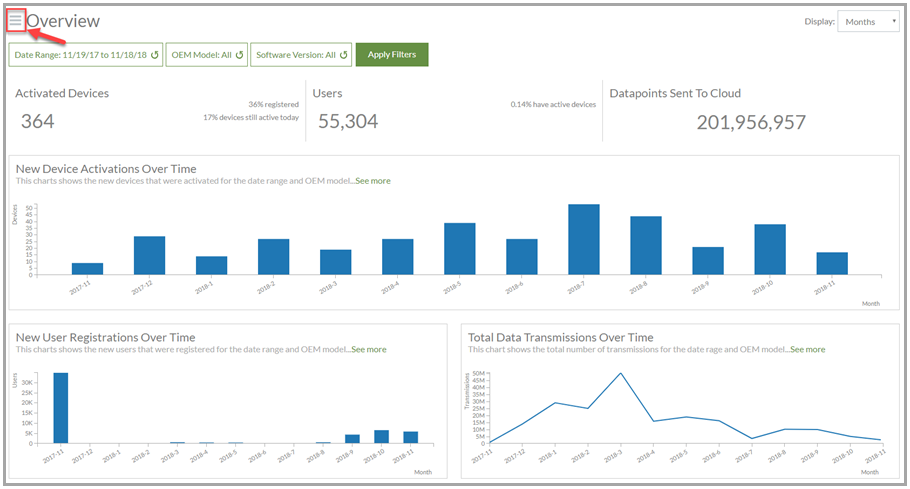
- Click Sign In to open the Overview page of Insights (which is the default landing page upon signing in).
Ayla Insights has ten sets of reports that provide data on your connected devices. Each set of reports has its own view in Insights. Following describes how to open the different sets of reports.
|
NOTE |
For a description of each set of reports, click the hyperlink for the report above. |
- Sign in to Ayla Insights to open the Overview set of reports. Overview is the default landing page when you sign in to Insights.
- Click the icon on the left of “Overview” at the top of the Overview landing page, (also called a hamburger icon). This displays the Ayla Insights navigational panel (shown below).
|
NOTE |
This icon is the same location on each page of the report sets. |
- Notice that all ten sets of reports are listed in the Insights navigation panel, as shown below.
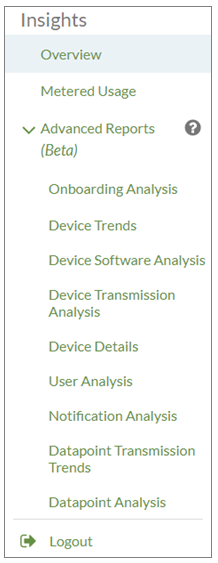
- In the Insights navigation panel, click the set of reports you wish to review, for example Device Trends (shown below), to open the page for those reports.
- Click the (hamburger) icon near “Device Trends” (shown below) to open the Insights navigation panel again.
- To access Advance Reports, contact your Ayla Product Specialist. If you place your mouse cursor over the question mark icon, there is note informing you of this as well.
- Click Logout to sign out of Ayla Insights.
You can modify the data shown in a set of reports based on specific filters. This enables you to visualize and analyze data to make product improvements, revenue predictions, etc. The following table provides a description of some of the common filters used in the ten Ayla Insight reports.
|
|||
| Software Version | This is the firmware image (specific software version) associated with the devices. It is either the version of the Ayla firmware on the Wi-Fi module, or the version of the host MCU's firmware that runs on the OEM's microcontroller unit (MCU). The host MCU is the product’s MCU that communicates directly with the Ayla-enabled Wi-Fi module using the Ayla module drivers. | ||
| Date Range |
This enables you to show data for a specific date or time frame. |
||
| OEM Model | This is a specific product model created by the OEM to represent that the product is connected to the Ayla cloud. This is also described as the name of the device that the OEM created. | ||
| Notification Type | This enables you to show device data based on a specific alert type (user-defined notification), such as SMS (short message service), email, push (set up and sent from server usually in real-time), forward, and so on. Notifications help monitor device activity. | ||
| Datapoint Name | This enables you to review and analyze device data for a specific datapoint (by its name, i.e. heat_on for a heater) of a device property (i.e. fan_speed for a ceiling fan or heat_set_point for a heater). | ||
| Property Name | This enables you to review and analyze device data for a specific device property. The property name usually refers to and matches the property on the device, i.e. Blue_LED. | ||
| Display Name | Like the Property Name filter, this enables you to review and analyze device data for a specific device property, but this filter is based on the display name, not the property name. The display name refers to the actual device (product), i.e. kitchen_light_on. | ||
| Datapoint Value | This enables you to review and analyze device property data for a specific datapoint value (i.e. 75 degrees Fahrenheit for the temperature property of a heater.) | ||
| DSN | This enables you to view specific datapoint transmission trends for a particular device by entering the device serial number (DSN). | ||
| Display | This enables you to show the data over weeks, months, or years. This filter is available for all report sets. | ||
|
NOTE |
When you select a filter in one set of reports, that same filter is set in all reports for which the filter is applicable. |
The following five reports have the same filters available (which are shown below this list):
- Overview
- Device Trends
- Device Software Analysis
- Device Usage Analysis
- User Analysis

The five reports in the table below have at least one of the three filters shown above, but each report also has additional filters enabling you to drill down on the data in the report for specific analysis needs.
|
|||
| Device Details | Date Range, OEM Model, Display, Notification Type. | ||
| Notification Analysis | Date Range, OEM Model, Notification Type, Property Name, Display Name, DSN. |
||
| Datapoint Transmission Trends | Date Range, OEM Model, Display, Property Name, Display Name, DSN, Datapoint Value. | ||
| Datapoint Analysis | Date Range, OEM Model, Display, Property Name, Display Name, DSN. | ||
| Onboarding Analysis | Date Range, OEM Model, Display. | ||
In all of the Ayla Insights reports, you can use the Date Range filter to visualize and analyze data for a specific date range.
- Click Date Range to open the Filter: Date Range dialog box, shown below.
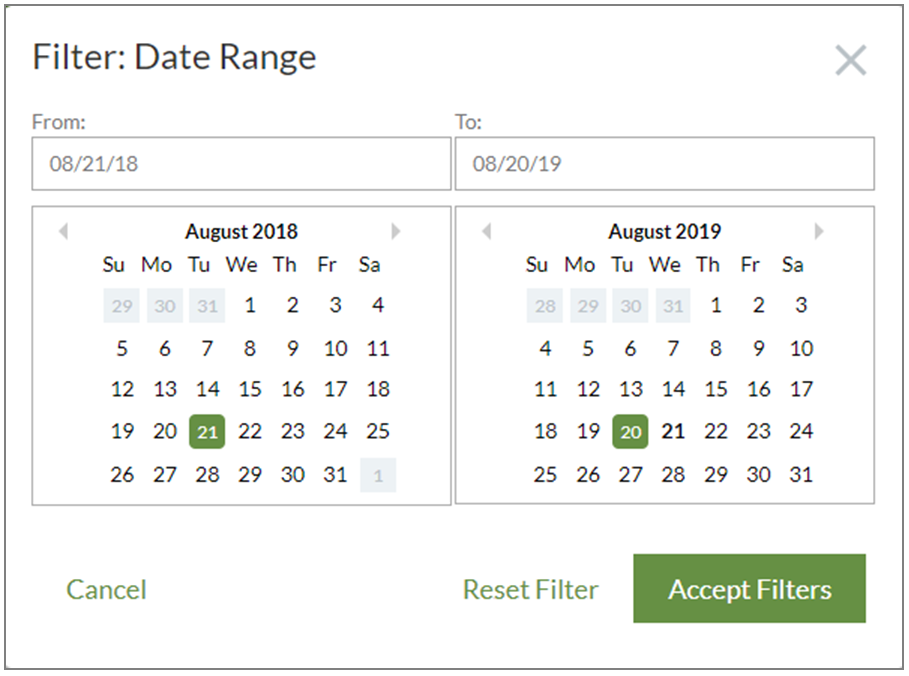
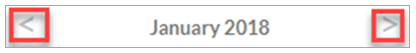
- Either type your date range in the From and To fields, or use the right and left selectors (shown below) to choose the month(s) and click the date in the calendars.
- Click Accept Filters to close the dialog box and display the results of your filter in the set of reports.
In all of the Ayla Insights reports, you can use the OEM Model filter to visualize and analyze data for a specific date range.
- Click OEM Model to open the Filter: OEM Model dialog box, shown below.
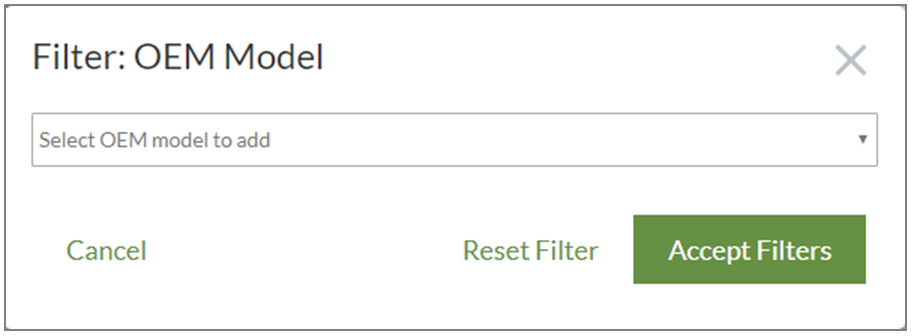
- Click the name of the OEM Model in the drop-down list to select the filter.
|
NOTE |
If you select the wrong OEM model, you can click Reset Filter to revert to the previous model or Cancel to close the dialog box without saving your changes. |
- Click Accept Filters to close the dialog box and display the results of your filter in the set of reports.
In all of the Ayla Insights reports, you can use the OEM Model filter to visualize and analyze data for a specific date range.
- Click Software Version to open the Filter: Software Version dialog box, shown below.
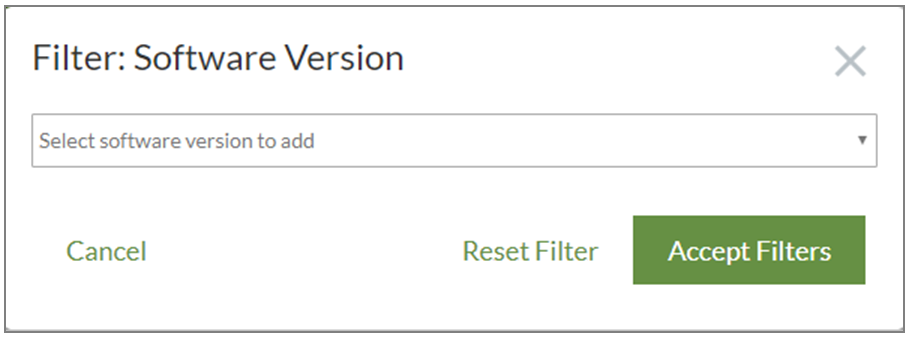
- Click the software version of the firmware in the drop-down list to select the filter.
|
NOTE |
You can click Reset Filter to revert to the previous software version or Cancel to close the dialog box without saving your changes. |
- Click Accept Filters to close the dialog box and display the results of your filter in the set of reports.
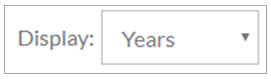
All the report sets, except Notification Analysis, have a Display filter that enables you to drill down to show the data (per the other filters applied) based on weeks, months, or years. Just click the drop-down list for Display (shown below) located in the upper right corner of the report page, and then click the option you prefer to view.
The Device Details and Notification Analysis report sets enable you to filter the results by a notification type (filter shown below).
- Click Notification Type to open the Filter: Notification Type dialog box, shown below.

|
NOTE |
Refer to the Ayla Developer Portal User’s Guide on Ayla Connection for more information on notifications. |
- Click the software version of the firmware in the drop-down list to select the filter.
|
NOTE |
If you select the wrong notification type, you can click Reset Filter to revert to the previous notification type or Cancel to close the dialog box without saving your changes. |
- Click Accept Filters to close the dialog box and display the results of your filter in the set of reports.
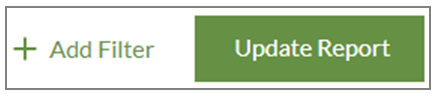
The Notification Analysis report provides additional filters enabling you to drill down to retrieve granular details. Notice the +Add Filter next to the Update Report button, as shown below:
- Click +Add Filter to display the drop-down list shown below:
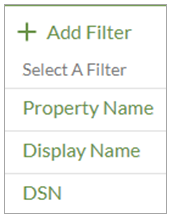
- To filter the results by Property Name, click Property Name, which opens the Filter: Property Name dialog box shown below:
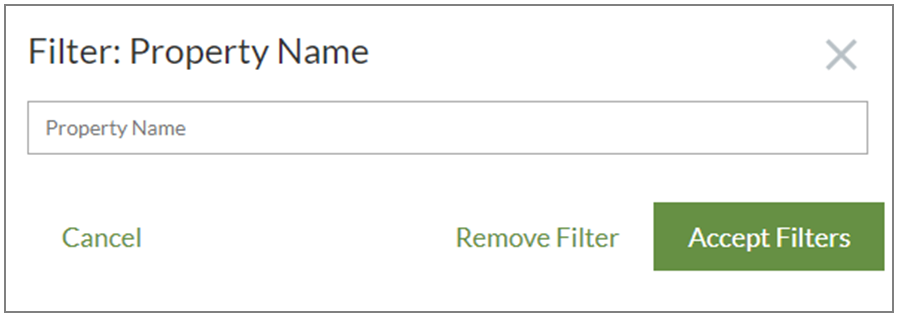
- Type the name of the property. The property name usually refers to and matches the property on the device, i.e. Blue_LED.
|
NOTE |
If you type the wrong property name, you can click Remove Filter to clear the name in the Property Name field or Cancel to close the dialog box without saving your changes. |
- Click Accept Filters to close the dialog box and display the results for the Property Name filter in the Notification Analysis reports.
- To filter the results by Display Name, click Display Name in the + Add Filter drop-down list (shown in Step 1 above). This opens the Filter: Display Name dialog box shown below:
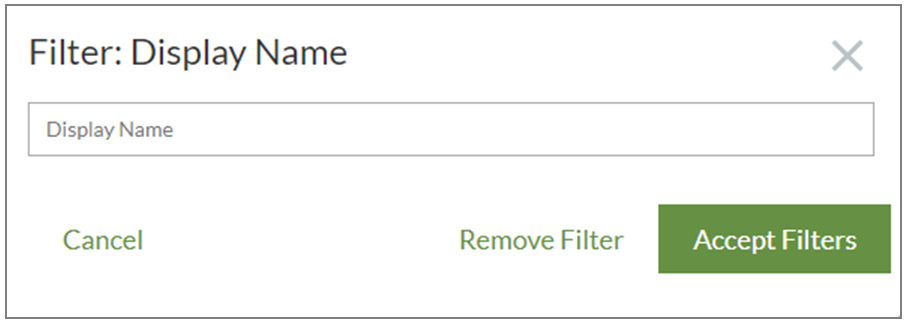
- Type the display name of the device property. The display name usually refers to the actual device (product) and the specific property, such as kitchen_light_on. (Unlike the property name which usually refers to (and matches) the property on the device, such as blue_LED).
|
NOTE |
If you type the wrong display name, you can click Remove Filter to clear the name in the Display Name field or Cancel to close the dialog box without saving your changes. |
- Click Accept Filters to close the dialog box and display the results for the Display Name filter in the Notification Analysis reports.
- To filter the results by the device serial number (DSN), click DSN in the + Add Filter drop-down list (shown in Step 1 above). This opens the Filter: DSN dialog box shown below:
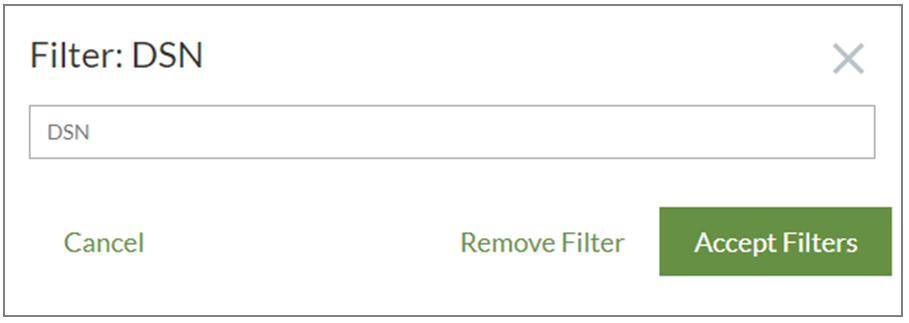
- Type the DSN of the device for which you would like to show in the results.
|
NOTE |
If you type the wrong DSN, you can click Remove Filter to clear the name in the DSN field or Cancel to close the dialog box without saving your changes. |
- Click Accept Filters to close the dialog box and display the results for the DSN filter in the Notification Analysis reports.
The Datapoint Transmission Trends report provides an additional DSN filter enabling you to drill down to retrieve granular details per the DSN.
- Click +Add Filter to display the drop-down list shown below:
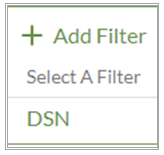
- Click DSN in the + Add Filter drop-down list to open the Filter: DSN dialog box shown below:
- In the DSN field, type the device serial number of the device for which you would like to show results.
|
NOTE |
If you type the wrong DSN, you can click Remove Filter to clear the DSN field or Cancel to close the dialog box without saving your changes. |
- Click Accept Filters to close the dialog box and display the results for the DSN filter in the Datapoint Transmission Trends report.
- Click +Add Filter to display the drop-down list shown below:
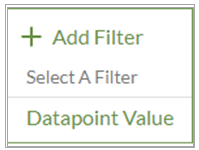
- Click Datapoint Value in the + Add Filter drop-down list to open the Filter: Datapoint Value dialog box shown below:
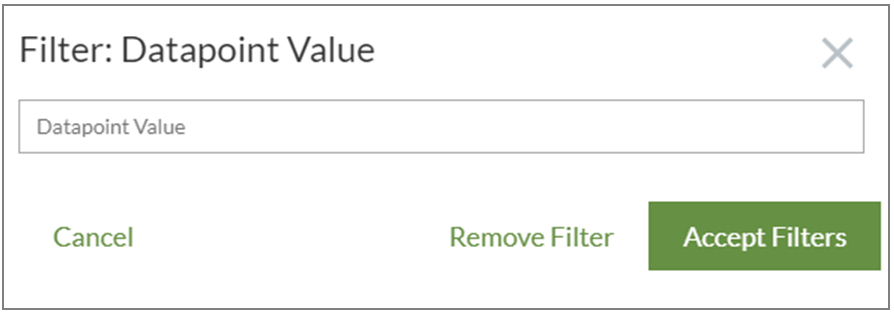
- Type the datapoint value for which you would like to show in results.
|
NOTE |
If you type the wrong datapoint value, you can click Remove Filter to clear the Datapoint Value field or Cancel to close the dialog box without saving your changes. |
- Click Accept Filters to close the dialog box and display the results for the Datapoint filter in the Datapoint Analysis report.
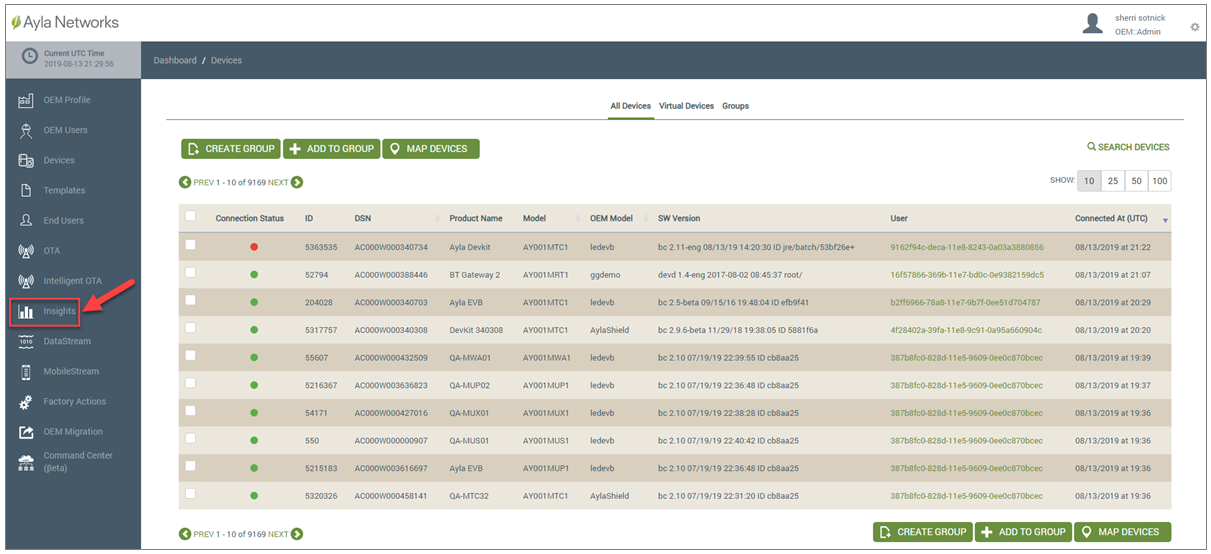
How to get here on the dashboard: Click Ayla Insights in the Navigation Panel.
See also: Access the Ayla Customer Dashboard, Insights Overview Reports, Insights Onboarding Analysis Reports, Insights Device Trends Reports, Insights Device Software Analysis Reports, Insights Device Transmission Analysis Reports, Insights Device Details Reports, Insights User Analysis Reports, Insights Notification Analysis Reports, Insights Datapoint Transmissions Trends Reports, Insights Datapoint Analysis Reports.
Please click here to let us know how we're doing. Thank you.